Customization through Interactive Design
Gaining Individual Insights into Research Data
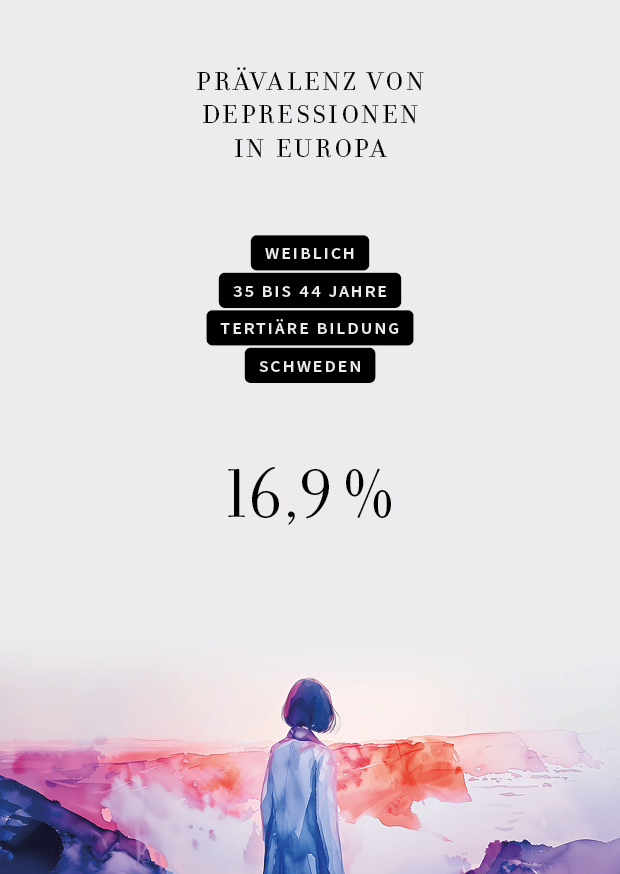
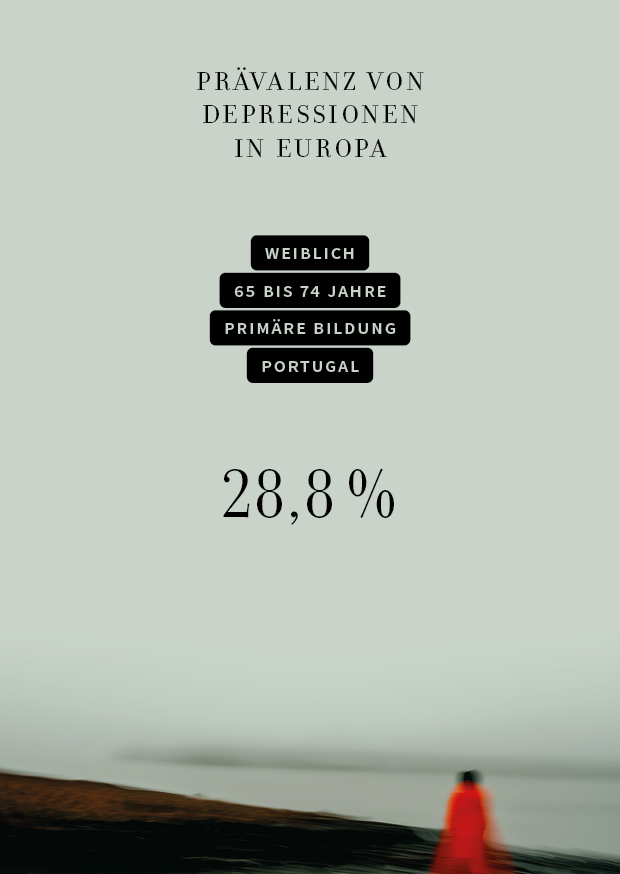
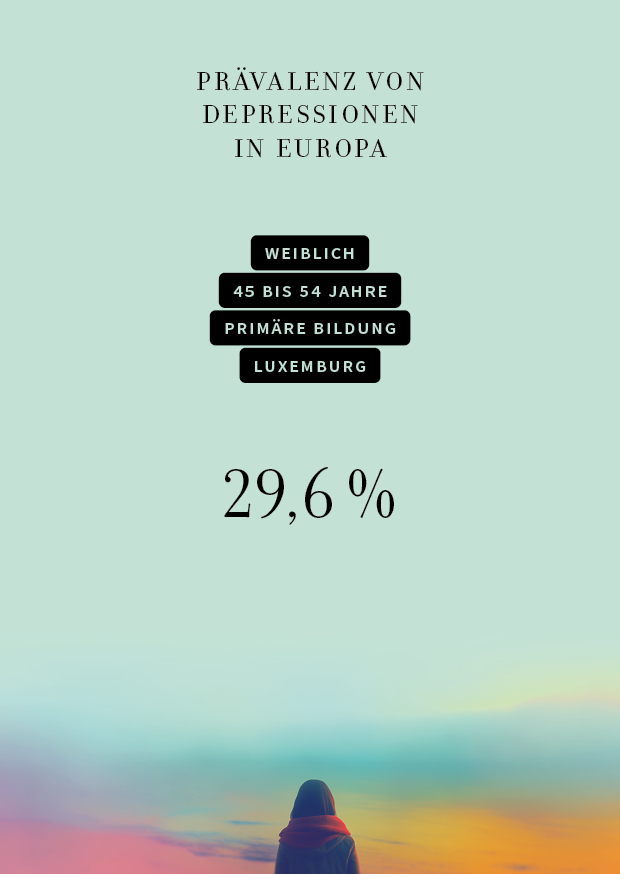
KielSCN designer Björn Döge has developed an interactive visualization for a Spektrum-Online article (in German only). It shows the prevalence of depression in Europe. Prevalence refers to the total number of cases of the disease in the population under consideration at a point in time or during a certain period of time. Users of the graph can filter the data set according to their individual interests. For example, there are filter options according to age, gender or country. The background graphic displayed also changes depending on the filter. These personalized insights help to explore the topic of depression in greater depth.

Implementation of the Project
All the information used in the graphic is based on data from the European Health Interview Survey (EHIS), a health survey conducted in all EU member states and some other European countries in 2019. Respondents indicated whether they had suffered from depression in the past 12 months or had observed various symptoms of the illness. In addition to the possibility of personalizing the data displayed, the depression graphic is characterized by an image motif in the background, which Björn Döge created with the help of the AI image generator Midjourney. This changes according to the selected filters.
Degree of Interaction with Different Versions of the Visualization
In order to analyse the effects on user interaction, we tested different versions of the visualization. For example, Spektrum readers were randomly shown different backgrounds. For some people, the background graphic was completely missing, some received static backgrounds, others the dynamic version. The team also implemented the visualization as an Observable Notebook to offer transparency and opportunities for participation. Data evaluation is currently underway to assess the effectiveness of the various visualization strategies.
Click on the button to load the content from observablehq.com.
The Aims of the Project
The project promotes the discussion of the topic of depression through personalized visualizations. At the same time, it investigates how different visualization strategies affect the acquisition of knowledge and the duration of user interaction. This interdisciplinary collaboration between KielSCN and Spektrum der Wissenschaft offers valuable insights into visual science communication and improves the effectiveness of public health messaging.
The visualization was published as part of an interview entitled “Depression. The long shadow of society”. Click here to go directly to the online article at Spektrum der Wissenschaft (in German only).
You can also find out more about the study and the development of the visualization in the IPN Journal No. 11 (in German only) from page 24.
More Posts on this Topic on our Website
- The KielSCN at the Museumsnacht Kiel on August 30th
On Friday, August 30, KielSCN will part of the Museumsnacht Kiel. Visitors can enjoy insights into the world of visual science communication. Anyone interested can learn more about the use of AI in the field of data visualization or explore the Midjourney Style Tuner to change images according to personal preferences.